
This Kinsta vs SiteGround comparison gives you a detailed, data-driven review of these two managed WordPress hosting services across performance metrics to help you decide which one best meets your needs. Let’s dive into the specifics to understand how Kinta stacks up against SiteGround.
When considering which hosting provider to go for, it’s a wise idea to keep the three S’s in mind: speed, security, and service.
Key Takeaways:
The main differences between Kinsta and SiteGround primarily lie in their hosting infrastructure, pricing, and target audience.
SiteGround’s servers are more responsive than Kinsta’s, as indicated by significantly lower Average Response Time and Time to First Byte.
SiteGround outperforms Kinsta in high-traffic situations. It has a much lower Highest Load Time, demonstrating better resilience under heavy load.
 SiteGround |  Kinsta | |
|---|---|---|
| Pricing | GoGeek plan starts from $7.99/month | From $35/month |
| SLA | 99.9% uptime. | 99.9% uptime. |
| Hosting types offered | Shared hosting, Managed hosting for WordPress and WooCommerce, and Cloud hosting. | Managed WordPress and WooCommerce hosting, hosting for apps and databases. |
| Speed and performance | SSD persistent storage. NGINX Direct Delivery. SiteGround CDN. PHP 8.0 and 8.1. Custom PHP and MySQL. GZIP compression, CSS&HTML modifications. SuperCacher. | SSD storage. HTTP/3. LXD containers. PHP 8.0 and 8.1. MariaDB. Edge caching. Cloudflare Enterprise CDN. Early Hints. |
| WordPress | Free WordPress installation. Auto-updates. 1-click staging. Free WP migration. | WordPress auto-installed. Auto-updates. 1-click staging. Free DevKinsta. |
| Servers | Google Cloud Platform | Google Cloud Platform |
| Security | Free SSL certificates. Smart WAF. AI Anti-bot. 24/7 server monitoring. Distributed backups. Free WordPress security plugin. Automatic daily backups. | Site Tools (proprietary custom dashboard) |
| Control Panel | Site Tools (proprietary custom dashboard). | MyKinsta (proprietary custom dashboard). |
| Extra Goodies | 24/7 support. Free email. 100% renewable energy match. | Free premium migrations. 24/7 expert support. |
| Money-back guarantee | 30 days | 30 days |
| Current deal | 🔥 Get up to 83% OFF SiteGround's plans | 🔥 Pay yearly & get 2 months of FREE hosting |
Because without them, your WordPress site will be dead in the water faster than you can shout SOS!
The thing is, your site visitors aren’t going to linger if they have to wait for your pages to load. And if your security is less than stellar, you can guarantee something malicious is going to be knocking on your door real soon.
To combat these problems, you need top-notch speed and performance, killer security features, and helpful customer service to troubleshoot when needed.
And it helps greatly if the price is attractive too.
Kinsta and SiteGround are two veritable giants in the web hosting world. They’re respected platforms known for their high-quality features, technology, and hosting services.
But which one is best? If you want to know which hosting platform to choose, read on.
Plans & Pricing
Cost matters, especially when prices are rising for practically everything. I get it, you want a high-quality WordPress hosting service but for an affordable price.
Let’s see if either platform has struck the right balance.
Kinsta Pricing Plans

Kinsta has a dizzying array of plans available – ten in total, in fact. These range from the lowest-tier plan of $35/month to $1,650/month for the highest-tier option.
- Starter: $35/month
- Pro: $70/month
- Business 1: $115/month
- Business 2: $225/month
- Enterprise 1: $675/month
- Enterprise 2: $1000/month
Paying annually nets you a nice discount of two months’ worth for free.
There are too many plans to discuss in detail here, but if you want the full info check out Kinsta’s pricing page. For peace of mind, all plans come with a 30-day money-back guarantee. There are optional add-ons, but they are somewhat technical and not really necessary for the average user.
Visit Kinsta for more information and their latest deals… or check out our Kinsta review here.
SiteGround Pricing Plans

SiteGround keeps it simple, with only three plans to choose between. The thing to be aware of here is the low promotional price for signing up. Upon renewal, the prices increase significantly.
- StartUp: $2.99/month
- GrowBig: $4.99/month
- GoGeek: $7.99/month
SiteGround’s GoGeek plan is their most powerful plan. With the Startup plan, SiteGround will manage one website, and with the GrowBig and GoGeek plans, they’ll manage unlimited sites for you.
Visit SiteGround for more information and their latest deals… or check out our SiteGround review here.
🏆 Winner is SiteGround
The promotional rates of SiteGround are certainly very attractive, but we know that nothing lasts forever. However, even at the standard pricing, SiteGround is waaay cheaper than Kinsta.
Even on the standard rates, SiteGround is still much more affordable than Kinsta. Therefore, this section is a no-brainer “win” for SiteGround.
Performance, Speed & Reliability
The main reason we’re all here. There’s no point in choosing a platform if it can’t provide you with reliable performance and speed, and SLAs mean nothing if the provider can’t actually deliver them.
Let’s pit the two platforms against each other and see which one delivers best.
In this section, you will find out…
- Why site speed matters… a lot!
- How fast a site hosted on Kinsta and SiteGround loads. We will test their speed and server response time against Google’s Core Web Vitals metrics.
- How a site hosted on Kinsta and SiteGround performs with traffic spikes. We will test how they perform when faced with increased site traffic.
The most important performance metric that you should look for in a web host is speed. Visitors to your site expect it to load fast instant. Site speed not only affects user experience on your site, but it also affects your SEO, Google rankings, and conversion rates.
But, testing site speed against Google’s Core Web Vitals metrics isn’t enough on its own, as our testing site does not have substantial traffic volume. To evaluate the efficiency (or inefficiency) of the web host’s servers when faced with increased site traffic, we use a testing tool called K6 (formerly called LoadImpact) to send virtual users (VU) to our test site.
Why Site Speed Matters
Did you know that:
- Pages that loaded in 2.4 seconds had a 1.9% conversion rate.
- At 3.3 seconds, the conversion rate was 1.5%.
- At 4.2 seconds, the conversion rate was less than 1%.
- At 5.7+ seconds, the conversion rate was 0.6%.

When people leave your website, you lose not only potential revenue but also all the money and time you spent generating traffic to your website.
And if you want to get to the first page of Google and stay there, you need a website that loads up fast.
Google’s algorithms prefer displaying websites that offer a great user experience (and site speed is a huge factor). In Google’s eyes, a website that offers a good user experience generally has a lower bounce rate and loads up fast.
If your website is slow, most visitors will bounce back, resulting in a loss in search engine rankings. Also, your website needs to load up fast if you want to convert more visitors into paying customers.

If you want your website to load up fast and secure the first spot in search engine results, you will need a fast web hosting provider with server infrastructure, CDN and caching technologies that are fully configured and optimized for speed.
The web host you choose to go with will significantly impact how fast your website loads.
How We Perform the Testing
We follow a systematic and identical process for all the web hosts we test.
- Buy hosting: First, we sign up and pay for the web host’s entry-level plan.
- Install WordPress: Then, we set up a new, blank WordPress site using the Astra WordPress theme. This is a lightweight multipurpose theme and serves as a good starting point for the speed test.
- Install plugins: Next, we install the following plugins: Akismet (for spam protection), Jetpack (security and backup plugin), Hello Dolly (for a sample widget), Contact Form 7 (a contact form), Yoast SEO (for SEO), and FakerPress (for generating test content).
- Generate content: Using the FakerPress plugin, we create ten random WordPress posts and ten random pages, each containing 1,000 words of lorem ipsum “dummy” content. This simulates a typical website with various content types.
- Add images: With the FakerPress plugin, we upload one unoptimized image from Pexels, a stock photo website, to each post and page. This helps evaluate the website’s performance with image-heavy content.
- Run the speed test: we run the last published post in Google’s PageSpeed Insights Testing tool.
- Run the load impact test: we run the last published post in K6’s Cloud Testing tool.
How We Measure Speed & Performance
The first four metrics are Google’s Core Web Vitals, and these are a set of web performance signals that are critical to a user’s web experience on both desktop and mobile devices. The last fifth metric is a load impact stress test.
1. Time to First Byte
TTFB measures the time between the request for a resource and when the first byte of a response begins to arrive. It’s a metric for determining the responsiveness of a web server and helps identify when a web server is too slow to respond to requests. Server speed is basically entirely determined by the web hosting service you use. (source: https://web.dev/ttfb/)
2. First Input Delay
FID measures the time from when a user first interacts with your site (when they click a link, tap a button, or use a custom, JavaScript-powered control) to the time when the browser is actually able to respond to that interaction. (source: https://web.dev/fid/)
3. Largest Contentful Paint
LCP measures the time from when the page starts loading to when the largest text block or image element is rendered on the screen. (source: https://web.dev/lcp/)
4. Cumulative Layout Shift
CLS measures unexpected shifts in the display of content in the loading of a web page due to image resizing, ad displays, animation, browser rendering, or other script elements. Shifting layouts lower the quality of the user experience. This can make visitors confused or require them to wait till the webpage loading is completed, which takes more time. (source: https://web.dev/cls/)
5. Load Impact
Load impact stress testing determines how the web host would handle 50 visitors simultaneously visiting the test site. Speed testing alone isn’t enough to test performance, as this test site doesn’t have any traffic to it.
To be able to evaluate the efficiency (or inefficiency) of a web host’s servers when faced with increased site traffic, we used a testing tool called K6 (formerly called LoadImpact) to send virtual users (VU) to our test site and stress test it.
These are the three load impact metrics we measure:
Average response time
This measures the average duration it takes for a server to process and respond to client requests during a specific test or monitoring period.
The average response time is a useful indicator of the overall performance and efficiency of a website. Lower average response times generally indicate better performance and a more positive user experience, as users receive quicker responses to their requests.
Maximum response time
This refers to the longest duration it takes for a server to respond to a client’s request during a specific test or monitoring period.This metric is crucial for evaluating the performance of a website under heavy traffic or usage.
When multiple users access a website simultaneously, the server must handle and process each request. Under high load, the server may become overwhelmed, leading to an increase in response times. The maximum response time represents the worst-case scenario during the test, where the server took the longest time to respond to a request.
Average request rate
This is a performance metric that measures the average number of requests per unit of time (usually per second) that a server processes.
The average request rate provides insights into how well a server can manage incoming requests under various load conditions. A higher average request rate indicates that the server can handle more requests in a given period, which is generally a positive sign of performance and scalability.
⚡Speed & Performance Test Results
The table below compares web hosting companies’ performance based on four key performance indicators: average Time to First Byte, First Input Delay, Largest Contentful Paint, and Cumulative Layout Shift. Lower values are better.
| Company | TTFB | Avg TTFB | FID | LCP | CLS |
|---|---|---|---|---|---|
| SiteGround | Frankfurt: 35.37 ms Amsterdam: 29.89 ms London: 37.36 ms New York: 114.43 ms Dallas: 149.43 ms San Francisco: 165.32 ms Singapore: 320.74 ms Sydney: 293.26 ms Tokyo: 242.35 ms Bangalore: 408.99 ms | 179.71 ms | 3 ms | 1.9 s | 0.02 |
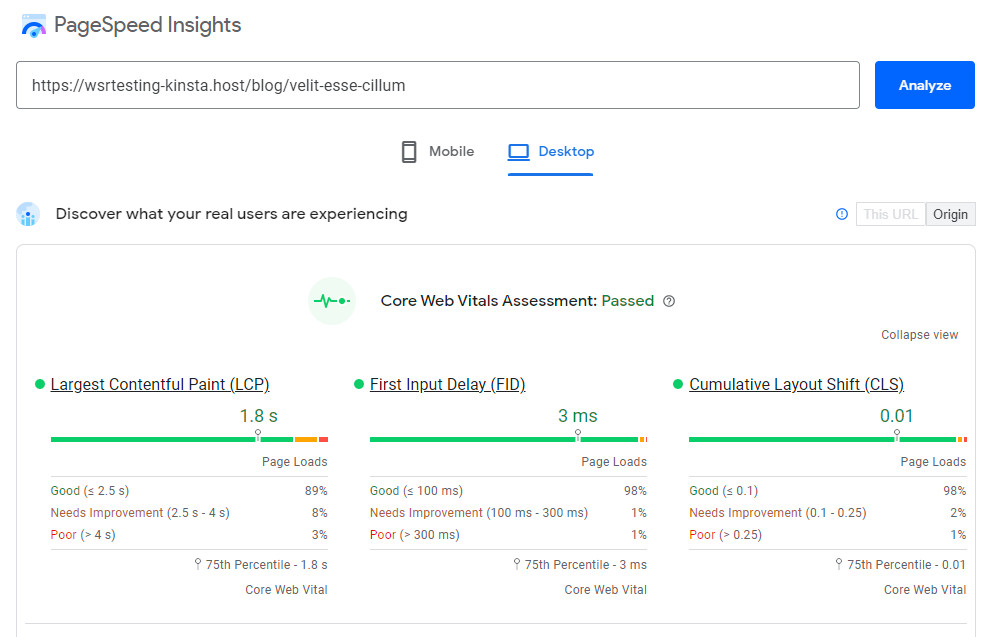
| Kinsta | Frankfurt: 355.87 ms Amsterdam: 341.14 ms London: 360.02 ms New York: 165.1 ms Dallas: 161.1 ms San Francisco: 68.69 ms Singapore: 652.65 ms Sydney: 574.76 ms Tokyo: 544.06 ms Bangalore: 765.07 ms | 358.85 ms | 3 ms | 1.8 s | 0.01 |
| Cloudways | Frankfurt: 318.88 ms Amsterdam: 311.41 ms London: 284.65 ms New York: 65.05 ms Dallas: 152.07 ms San Francisco: 254.82 ms Singapore: 295.66 ms Sydney: 275.36 ms Tokyo: 566.18 ms Bangalore: 327.4 ms | 285.15 ms | 4 ms | 2.1 s | 0.16 |
| A2 Hosting | Frankfurt: 786.16 ms Amsterdam: 803.76 ms London: 38.47 ms New York: 41.45 ms Dallas: 436.61 ms San Francisco: 800.62 ms Singapore: 720.68 ms Sydney: 27.32 ms Tokyo: 57.39 ms Bangalore: 118 ms | 373.05 ms | 2 ms | 2 s | 0.03 |
| WP Engine | Frankfurt: 49.67 ms Amsterdam: 1.16 s London: 1.82 s New York: 45.21 ms Dallas: 832.16 ms San Francisco: 45.25 ms Singapore: 1.7 s Sydney: 62.72 ms Tokyo: 1.81 s Bangalore: 118 ms | 765.20 ms | 6 ms | 2.3 s | 0.04 |
| Rocket.net | Frankfurt: 29.15 ms Amsterdam: 159.11 ms London: 35.97 ms New York: 46.61 ms Dallas: 34.66 ms San Francisco: 111.4 ms Singapore: 292.6 ms Sydney: 318.68 ms Tokyo: 27.46 ms Bangalore: 47.87 ms | 110.35 ms | 3 ms | 1 s | 0.2 |
| WPX Hosting | Frankfurt: 11.98 ms Amsterdam: 15.6 ms London: 21.09 ms New York: 584.19 ms Dallas: 86.78 ms San Francisco: 767.05 ms Singapore: 23.17 ms Sydney: 16.34 ms Tokyo: 8.95 ms Bangalore: 66.01 ms | 161.12 ms | 2 ms | 2.8 s | 0.2 |

SiteGround:
- TTFB: The values range from 29.89 ms (Amsterdam) to 408.99 ms (Bangalore). This shows that the company has excellent performance in European locations but significantly slower in Asian locations.
- Avg TTFB: The average TTFB is 179.71 ms, which is fairly good and is impacted by the slower TTFB in Asian locations.
- FID: The FID is 3 ms, indicating a fast response time to user interactions.
- LCP: The LCP is 1.9 s, suggesting that the main content of the page loads relatively quickly.
- CLS: The CLS is 0.02, indicating that the visual stability of their pages is good (values below 0.1 are typically considered good).
Kinsta:
- TTFB: The values range from 68.69 ms (San Francisco) to 765.07 ms (Bangalore). This shows a wide range of performance with slower TTFB in most locations when compared to SiteGround.
- Avg TTFB: The average TTFB is 358.85 ms, almost double that of SiteGround, showing overall slower server responsiveness.
- FID: The FID is also 3 ms, which is equal to SiteGround’s, suggesting similarly fast responses to user interactions.
- LCP: The LCP is slightly better than SiteGround’s at 1.8 s, indicating slightly faster loading of main content.
- CLS: The CLS is 0.01, indicating excellent visual stability of their pages, slightly better than SiteGround’s.
SiteGround has better server responsiveness as indicated by TTFB, while Kinsta has slightly better loading performance and visual stability. Both seem to handle user interactions equally well.
⚡Load Impact Test Results
The table below compares web hosting companies’ performance based on three key performance indicators: Average Response Time, Highest Load Time, and Average Request Time. Lower values are better for Average Response Time and Highest Load Time, while higher values are better for Average Request Time.
| Company | Avg Response Time | Highest Load Time | Avg Request Time |
|---|---|---|---|
| SiteGround | 116 ms | 347 ms | 50 req/s |
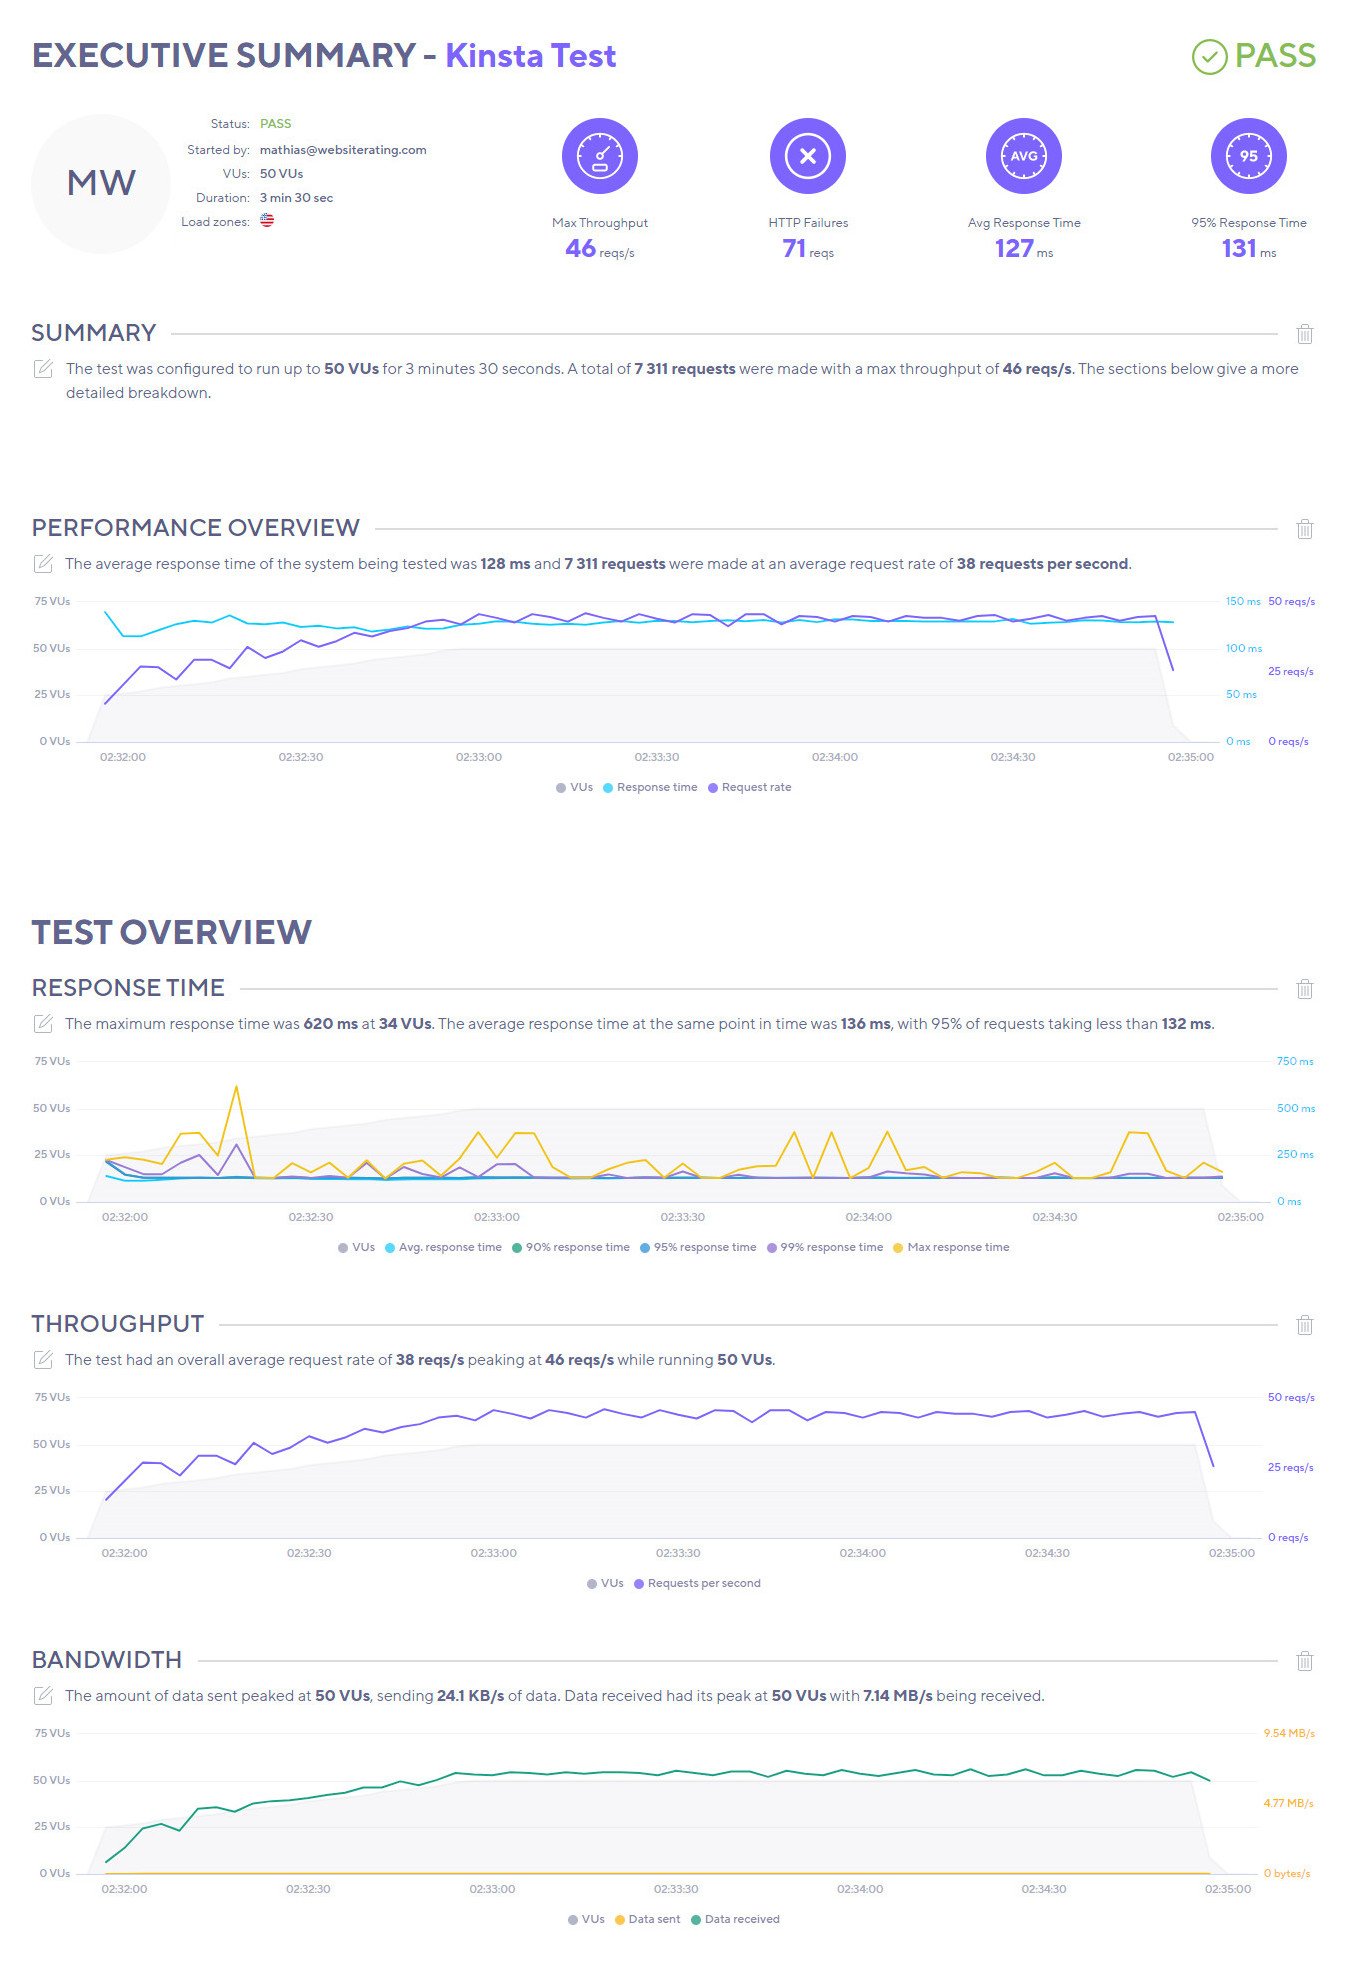
| Kinsta | 127 ms | 620 ms | 46 req/s |
| Cloudways | 29 ms | 264 ms | 50 req/s |
| A2 Hosting | 23 ms | 2103 ms | 50 req/s |
| WP Engine | 33 ms | 1119 ms | 50 req/s |
| Rocket.net | 17 ms | 236 ms | 50 req/s |
| WPX Hosting | 34 ms | 124 ms | 50 req/s |
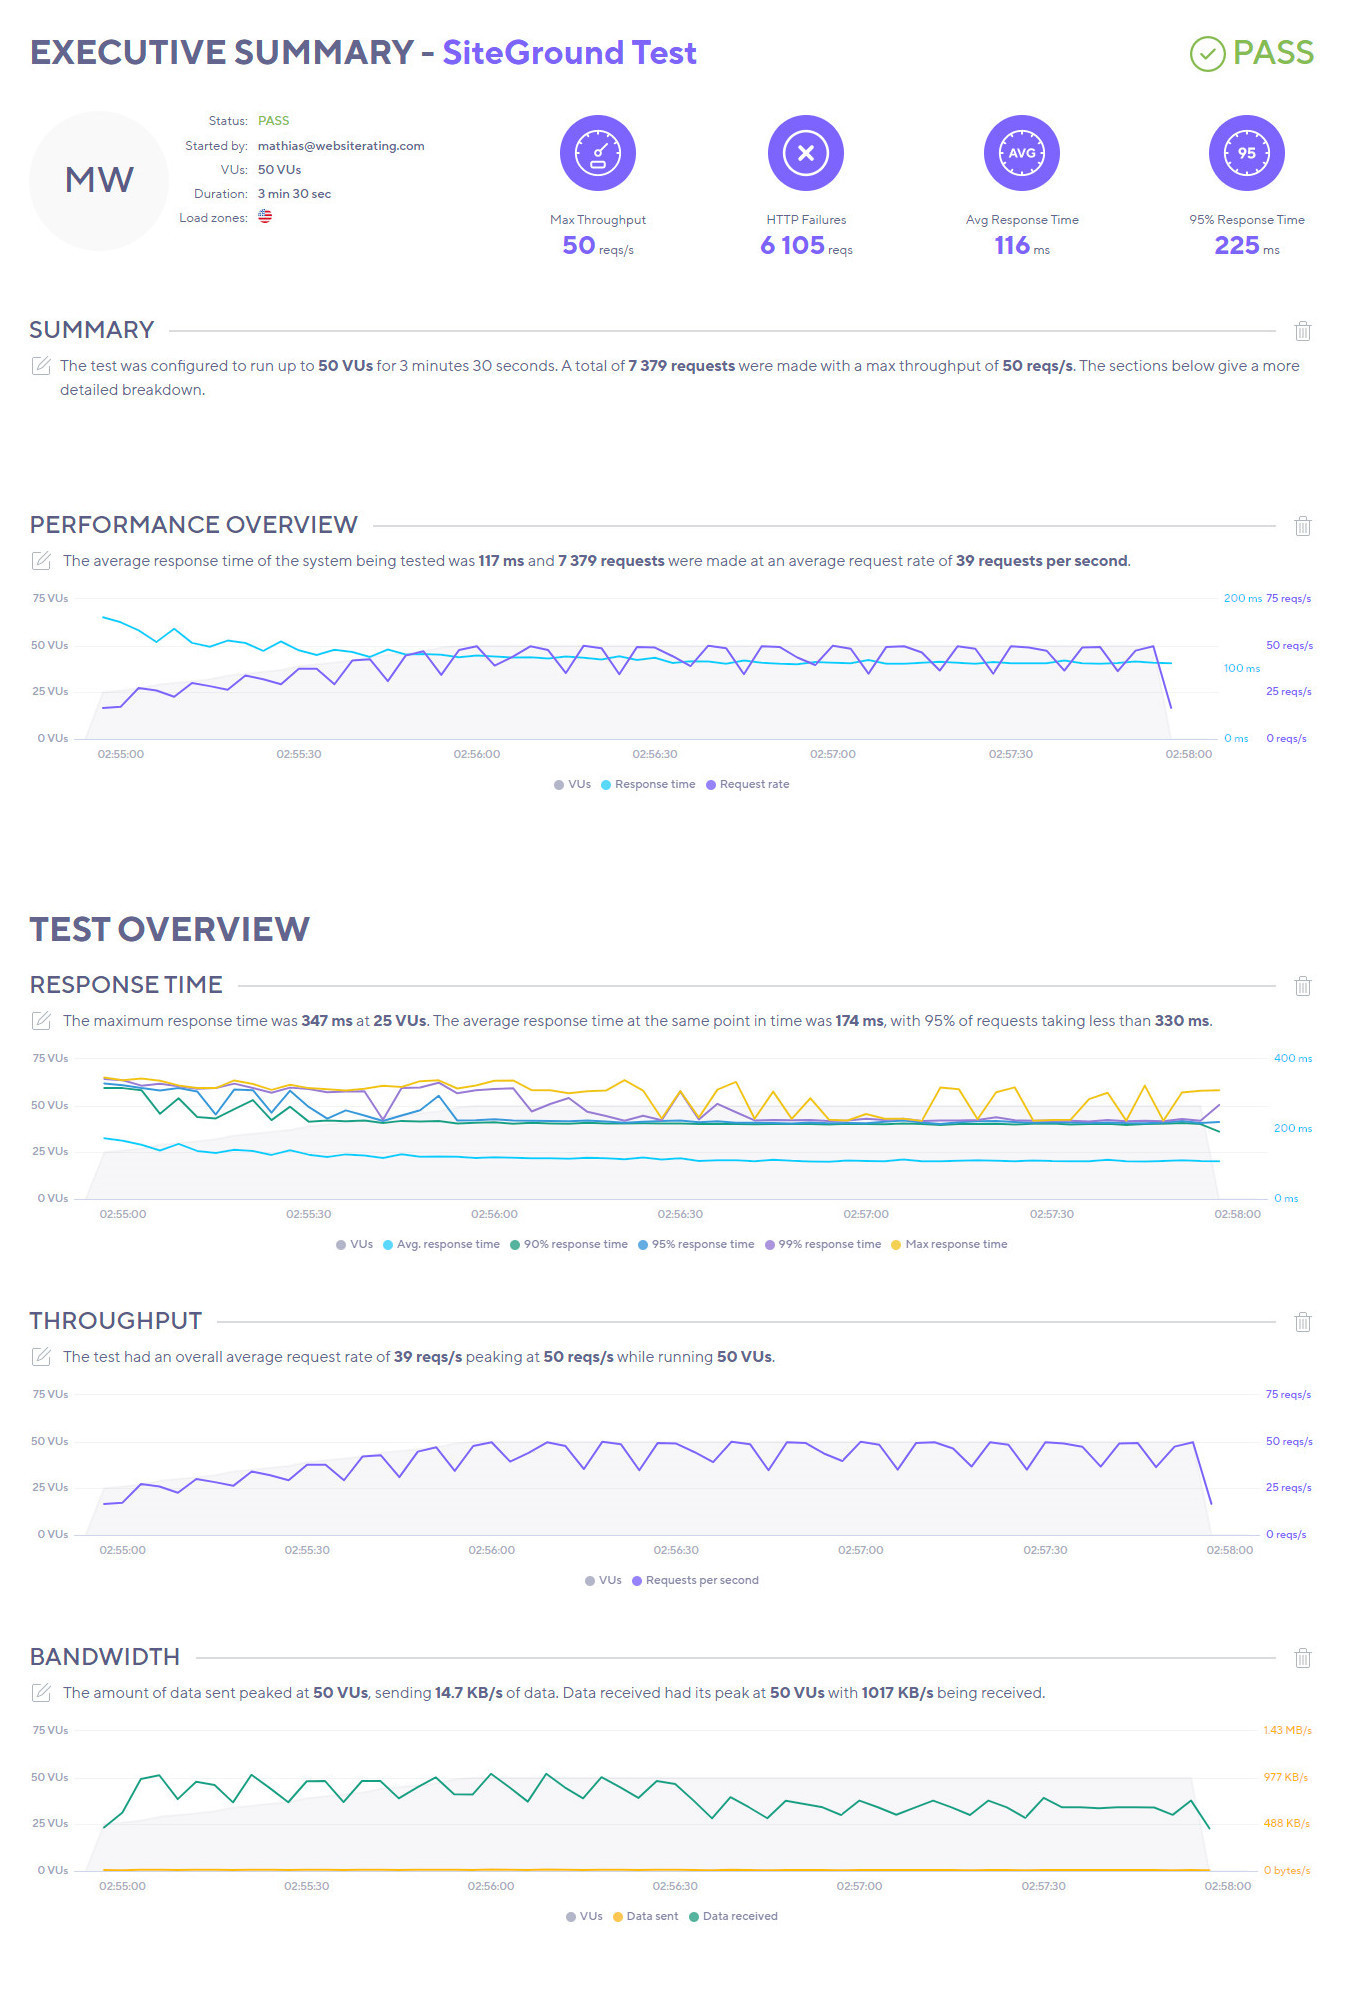
SiteGround:
- Avg Response Time: The average response time for SiteGround is 116 ms, which is pretty good and indicates a responsive server.
- Highest Load Time: The highest load time is 347 ms. This indicates that even under heavy load, the server is still fairly responsive.
- Avg Request Time: SiteGround processes an average of 50 requests per second, which is a strong number and suggests a high capacity to handle traffic.
Kinsta:
- Avg Response Time: The average response time for Kinsta is slightly higher than SiteGround at 127 ms. This suggests that Kinsta’s server is slightly less responsive than SiteGround’s.
- Highest Load Time: Kinsta’s highest load time is significantly higher than SiteGround’s at 620 ms. This suggests that Kinsta’s performance may degrade more under heavy load.
- Avg Request Time: Kinsta processes an average of 46 requests per second, slightly lower than SiteGround. This suggests that Kinsta may have a slightly lower capacity to handle traffic compared to SiteGround.
SiteGround has a performance advantage over Kinsta, with a more responsive server, better performance under load, and a higher capacity for handling traffic.
Kinsta Performance Features
Kinsta achieves exceptional performance by exclusively utilizing the Google Cloud network of high-performing CPU servers. Not only that, it uses the Premium Tier network, which means you get even better performance and speed.

Ultimately, this well-provisioned, private fiber network ensures reliable and low-latency connectivity, resulting in a performance boost of 30% – 300% for its users. A big plus in my book and a good reason why Kinsta has a fairly high premium for its plans.
Moving on, the SSD-based storage with built-in redundancy ensures high data integrity, while backups and staging environments are excluded from storage calculations.

Kinsta has a huge number of data centers worldwide. 35+, in fact. This lets users choose the location that makes the most sense for them and ensures fast data delivery to their WordPress sites.
Additionally, Kinsta’s high-performance CDN, powered by Cloudflare integration, serves up content at lightning-fast speeds. Furthermore, it supports HTTP/3 and is available from over 275 POPs locations globally.
It’s safe to say that Kinsta’s network is vast and covers all bases for exceptional service.
Kinsta provides a premium Anycast DNS service, which is powered by Amazon Route53. It supports latency and geolocation-based routing, ensuring fast response times and stability.

The platform provides proprietary Edge Caching software, which guarantees you a 50% reduction in TTFB, a 55% reduction in time to transfer complete pages, and a time reduction of around 50% to serve cached HTML WordPress.
That’s a whole lot of time-saving in one hit, and your WordPress website users will greatly appreciate the efficient page loading times as they browse.

To complete this section, Kinsta also offers:
- The latest version of PHP, including 8.0 and 8.1
- Automatic WordPress and platform updates
- One-click site management tools
- Optimization tools such as CDN enablement and disablement, image optimization controls, CSS and JS minification, and excluding files.
- The Cloudflare “Early Hints” web standard (can improve speeds up to 30%)
SiteGround Performance Features
Like Kinsta, SiteGround makes use of the Google Cloud Platform but only has ten data centers across the globe. Each data center utilizes enterprise-class UPS technology for uninterrupted network technology and a top-level of redundancy for critical components.

This technology also ensures you get high availability, low latency, and reliability for all your hosted WordPress sites.
Next up is the free CDN (included on all plans, too!), which is vital for boosting your speeds since it caches your web content and distributes it across the globe to SiteGround’s servers. Currently, SiteGround has CDNs in 16 locations scattered across the world.
This is greatly beneficial if your website sees traffic across different continents and countries because it means those people aren’t left hanging while the service goes and fetches the data they requested.
Additionally, the CDN helps out further by automatically blocking malicious traffic (because no one wants that type of thing) and provides insightful traffic analysis for you to view.
Ultimately, SiteGround’s CDN is known to improve speeds by at least 20%. In some cases, this goes up to 100% in certain parts of the world.

SiteGround’s SuperCacher software delivers extra speed by working to cache page results from database queries and dynamic pages that you have. The technology provides three different caching levels:
- NGINX Direct Delivery: Improves loading time by caching static web content and storing it in the server’s RAM
- Dynamic Cache: A full-page caching service for non-static page elements. This level boosts your page’s TTFB (time to first byte)
- Memcached: Improves the connection between application and database while accelerating dynamic content loading times
Another neat piece of software is Siteground’s custom MySQL setup. This deals with heavy MySQL queries efficiently by allowing a high number of parallel requests to be processed simultaneously. The result is a significant drop in the number of slow queries. In fact, the technology brings them down by around 10 – 20 times.

To give you even more of a boost, SiteGround has its own WordPress Optimizer plugin, which was specifically created to make WordPress sites run more efficiently. This plugin lets you set the optimal PHP version, switch on the HTTPS option, and provides a whole bunch of image optimization options. Lazy loading and minification? Yes, please!
And what else does SiteGround have to offer to ensure excellent speed and performance? Here’s the rest of it:
- The latest version of PHP, including 8.0 and 8.1
- Automatic WordPress updates for unlimited websites
- GZIP compression
- CSS & HTML minifications
- Brotli compression
🏆 Winner is SiteGround
I’ll admit, this was a close one. Both platforms offer excellent performance and infrastructure and faultless uptime. But SiteGround is better than Kinsta!
- Server Responsiveness: In terms of server responsiveness, as measured by the Time to First Byte (TTFB) and Average Response Time, SiteGround consistently outperforms Kinsta. In the first test, SiteGround’s average TTFB was almost half that of Kinsta (179.71 ms compared to 358.85 ms). Similarly, in the second test, SiteGround’s average response time was quicker than Kinsta’s (116 ms compared to 127 ms).
- Performance Under Load: When evaluating the highest load time, SiteGround significantly outperforms Kinsta. SiteGround’s highest load time was 347 ms, while Kinsta’s was almost double at 620 ms. This indicates that SiteGround’s servers maintain better performance and responsiveness even under heavy load.
- Handling Traffic: SiteGround also has a slight edge in terms of handling traffic, as indicated by the average request time. SiteGround processes an average of 50 requests per second, while Kinsta processes slightly fewer at 46 requests per second. This indicates that SiteGround’s servers can handle more simultaneous requests, making it better equipped to deal with high-traffic situations.
SiteGround outperforms Kinsta. The tests suggest that SiteGround’s servers are more responsive, handle high-load situations better, and are better equipped to manage high-traffic situations.
Security
These days, it’s necessary to have security stronger than Fort Knox; otherwise, those malicious beasties can quickly find a way to slip through the cracks and ruin all your hard work.
Hosting providers know how crucial a safe and secure site is for their subscribers and therefore provide a raft of measures and tools to lock it down.
Let’s see how Kinsta and SiteGround stack up here.
Kinsta Security Features

A premium price means premium security, and Kinsta takes this to the next level with a very respectable number of high-quality security features and tools:
- Enterprise-level firewall DDoS protection
- SSL management
- 99.9% uptime SLA
- SFTP/SSH protocols
- Free wildcard SSL support by Cloudflare
- HTTP/3 support
- Automatic daily backups and storage of the previous 14 backups to restore if needed
- Malware security pledge (this includes active and passive security and hardware firewalls)
- One staging environment to try out new plugins or make changes without fearing your live site will crash
- Two-factor authentication
- IP banning after six failed login attempts
The finishing flourish to this large list is Kinsta’s hack-free guarantee. While the platform is pretty confident it won’t let anything nefarious creep in, it’s got your back if something does manage to sneak past.
Essentially, the guarantee ensures you get a free fix, so you don’t have to spend valuable time and money sorting the problem out. Neat, huh?
SiteGround Security Features

Here are the security features you can look forward to with SiteGround:
- Hardware firewall filtering and software firewall for DDOS protection
- Failed login attempt monitoring and filtering
- Smart web application firewall (WAF) with continuous patching
- AI anti-bot protection to prevent brute-force attacks before they reach customer’s websites (according to SiteGround, this prevents an incredible 500,000 and 2 million brute-force attempts per hour)
- In-house server monitoring system, which checks the system every 0.5 seconds and detects and fixes issues automatically
- Automatic geographically distributed daily backups with 30 days’ worth of copies to refer back to. Up to five on-demand backups can also be created at any single time
- Free standard or Wildcard SSL certificate for each WP site
- Site Scanner malware early detection system
- 1-click staging for testing before going live
On top of all that, all subscribers get to use the free SiteGround WordPress security plugin. This powerful little tool lets you switch on “rules” that harden your site against attacks. It also provides 2-factor authentication and provides an activity log so you can see exactly who is doing what on your site.
🏆 Winner is SiteGround
Like performance, this is another close one, but SiteGround takes the win here. Its exclusive WordPress security plugin is ace, plus you get twice as many backup copies than Kinsta.
That said, both are highly secure platforms with premium-grade technology, so you won’t go wrong with either. It’s just that SiteGround offers more for less here.
Technical Support
Kinsta Technical Support

Kinsta provides its subscribers with live English language chat support around the clock on all plans. 24/7, 365.
While French, Italian, Spanish, and Portuguese chat support is also available, it is only offered from Monday to Friday during office hours.
Additionally, users can reach out to the support team via email anytime they like and request a callback if they prefer to chat.
When we tested this support out, we found we got a live chat response in under five minutes (mostly, it was around a minute’s wait), while email responses took around a day to get a response.
Overall, it’s a decent level of support, and having a live chat available at all times is definitely valuable.
SiteGround Technical Support

SiteGround’s support is also plentiful and provides a number of methods to get in touch. First of all, you can contact live chat support 24/7.
Customers can also call SiteGround’s support team. The phone number differs depending on where the customer is based, and an access code will be required to ensure identification. Both the number and the access code become available when you log into the client area and click to contact customer service.
For complex issues that need a lot of troubleshooting, there is also an email ticketing service available.
When testing out these contact methods, we found live chat and answering the phone was virtually instantaneous, and getting a response from an email ticket took around an hour.
🏆 Winner is SiteGround
I feel that SiteGround has provided more than enough ways to get in touch. Having phone support readily available is also invaluable because some issues or help requests just can’t easily be explained in writing.
I also found that SiteGround was faster overall at responding. Excellent work all around.
Questions & Answers
Our Verdict ⭐
I like both of these platforms. I believe they are well-matched in terms of what they offer their subscribers but with one very notable difference.
The price.
Let’s ignore SiteGround’s awesome promotional prices for the minute and consider both platforms’ standard pricing. It’s clear that SiteGround blows Kinsta out of the water here and is WAY cheaper, no matter which of its plans you opt for.
SiteGround stands out in the web hosting industry - they're not just about hosting your website but about enhancing your site's performance, security, and management. SiteGround's hosting package blends advanced technology and user-friendly features, ensuring your website operates at its best. Get premium website performance with Ultrafast PHP, optimized db setup, built-in caching & more! The ultimate hosting package with free email, SSL, CDN, backups, WP auto-updates, and much more.

In Kinsta’s defense, it does have a lot more plans to choose from, and enterprise-grade businesses are probably going to be more interested in what Kinsta has here. But for the average Joe with one or a handful of websites – SiteGround is by far the more attractive option.
Therefore, I hereby declare the winner of this article: SiteGround! To get started with SiteGround, click here to sign up.
How We Review Web Hosts: Our Methodology
When we review web hosts, our evaluation is based on these criteria:
- Value for Money: What types of web hosting plans are on offer, and are they good value for money?
- User Friendliness: How user-friendly is the signup process, the onboarding, the dashboard? and so on.
- Customer Support: When we need help, how quickly can we get it, and is the support effective and helpful?
- Hosting Features: What unique features does the web host provide, and how do they stack up against competitors?
- Security: Are essential security measures like SSL certificates, DDoS protection, backup services, and malware/virus scans included?
- Speed and Uptime: Is the hosting service fast and reliable? What types of servers do they use, and how do they perform in tests?
For more details on our review process, click here.